Market summary
The U.S market’s continued rebound had puzzled many investors and the big question remains – will the market rally continue despite the bad economic data in recent period or will the sell-off return? Last week, the market rallied in hope of the trillion-dollar stimulus package and the easing of the lockdown bring some relief to the market but the structural and bureaucratic issues in the United States may slow down the process of the stimulus package being distributed. The amount of damage by the virus on the economy is huge and several rounds of stimulus will be needed to resolve the systemic problem faced by the economy. However, partisan politics will likely slow the process of passing the next stimulus package.
Next, the health of the workforce must be taken into account as the lockdown has eased. Should the workers in the United States be affected by a continued rise in the COVID-19 infections, productivity levels of the economy will decrease.
The key factor on why the current crisis is different from past crises such as the 2008 Global Financial Crisis is that the current crisis is triggered by a worldwide pandemic, which revealed the fundamental weakness in the U.S economy after decades of mismanagement. The stock market rally may continue but as it is approaching key technical resistance levels, the market is showing signs of uneasiness and the tug of war between the stimulus and poor economic data will likely turn the whole market into a prolonged ranging pattern. Will market rationality triumph this time around?
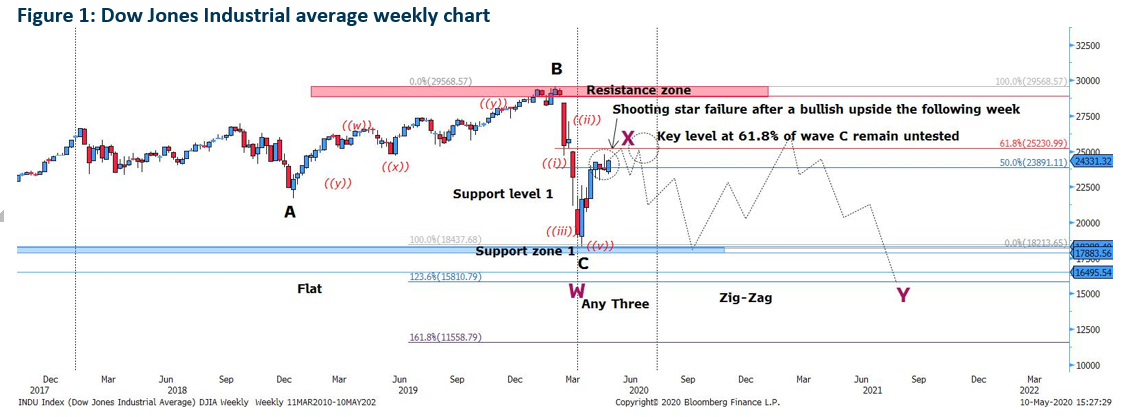
The shooting star two weeks ago had a high chance of being invalidated as there was a strong bullish rise last week. Based on the wave analysis, we maintain an outlook of a potential double-three corrective wave action with price levels edging closer to the 61.8% of wave C of the expanding flat. Should there be a clear sign of rejection at 61.8%, the 2nd leg of the 3 sub-wave within the double-three will be formed and this will further increase the probability of a prolonged range of the double-three.
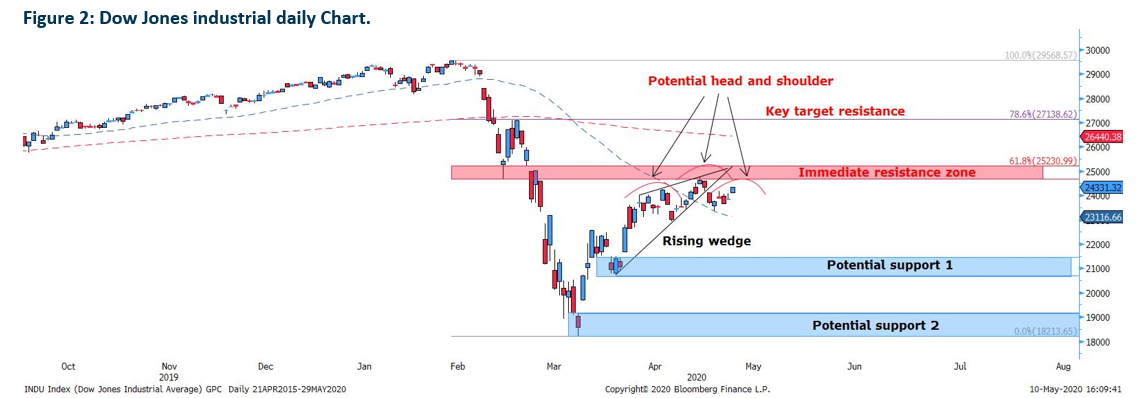
Dow Jones industrial daily chart shows a potential head-and-shoulder and the immediate resistance at 24,600 level remains a key level to watch. If the resistance level is invalidated, the next immediate level to be tested will be at 61.8% of the Fibonacci retracement level of wave C, which was mentioned in the weekly chart.
Looking closely, while the price has broken out of the rising wedge, the stock remains in a ranging manner. In other words, the stock remains a range within a range.
Key resistance levels are between 24,600 – 25,231 and potential rebound level is between 20,761 – 21,509 and 18,213.65 – 19,073.80.
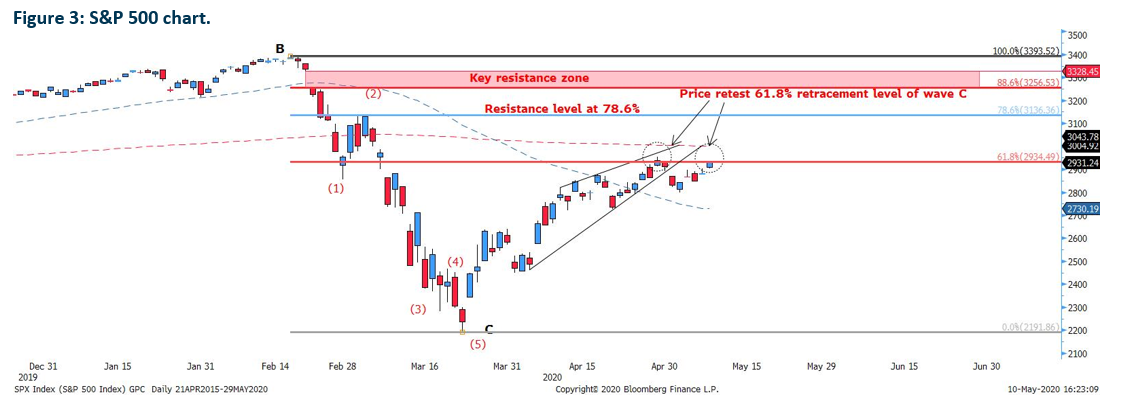
SPX 500 had the same structure as Dow Jones Industrial Average but the only difference is that SPX 500 has broken the resistance level of 2,860 and is testing the 61.8% of wave C twice, forming a potential double-top. Should the price break above the 61.8% for two consecutive periods and above the 3,000 psychological level, then the next level to be tested is at 78.6% of the Fibonacci retracement level of wave C at 3,136.36.
Key rebound level remains at the 2,528 level and the 2,191 level.
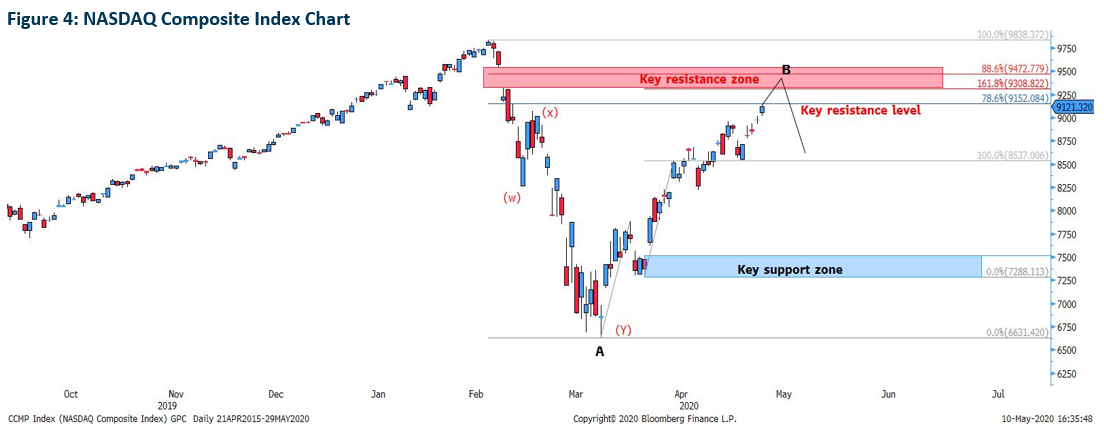
NASDAQ is the only index whose growth surpassed the DJIA and SPX 500. It is also the only index with 3-3-5 sub-waves. Nasdaq composite closed at a high of 9,047 on Friday. However, the key resistance zone between 9,190 – 9,390 is a crucial level to look out for as it confluences with the 88.6% retracement level of wave A and 161.8% of wave (w)-(x). Furthermore, the strong bearish gap is located near key Fibonacci levels. Should prices reject the resistance zone, we will be looking at a strong downside towards the key support zone at the 7,288 – 7,688 region.
Breaking of the resistance zone will see prices testing historical levels of 10,000 points.
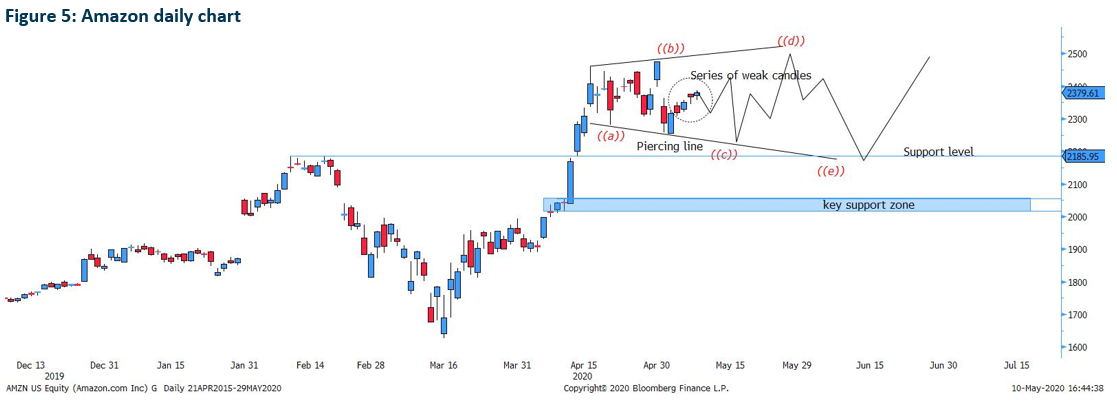
Amazon has been a darling of many investors during the sell down which saw prices rally from 1,626 to 2,475. However, as mentioned on the 20th April report, the upside is limited and it has yet to break the recent highs since. Current analysis suggests that Amazon is forming a 5-wave expanded triangle with prices testing the 2,500 high at wave ((d)). However, the key rebound level remains at wave ((e)), which remains at the 2,185.95 level or key support zone at 2,000 – 2,048.61.
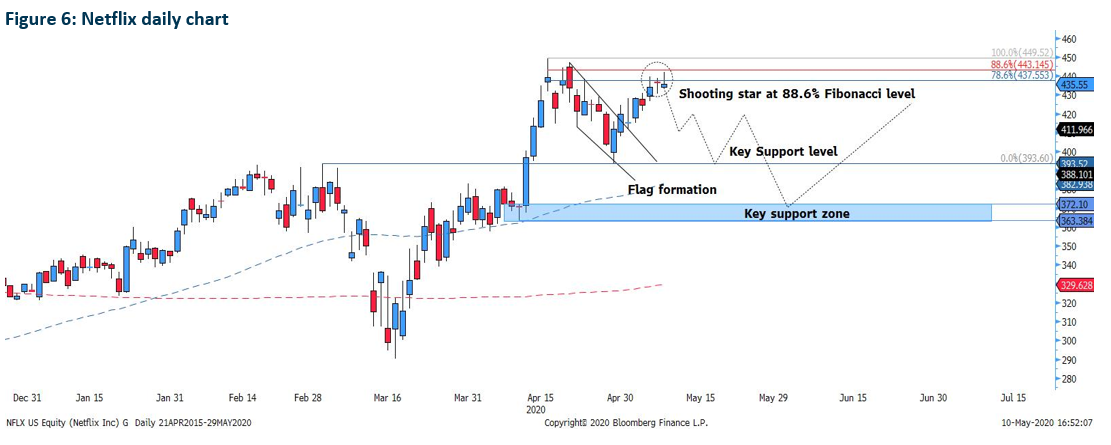
Netflix had a strong rebound at 393.60 after a sell-down on 22nd April. The rebound was strong with prices breaking out of the flag formation. It even invalidated the shooting star formation on 1st of May. However, the rally proved to be short-lived when price tested the 78.6% and 88.6% of the flag after a shooting star candlestick was formed. As such, we believe that the stock is heading downwards to retest the support level at 393.60 or 363.38 – 372.10 region.
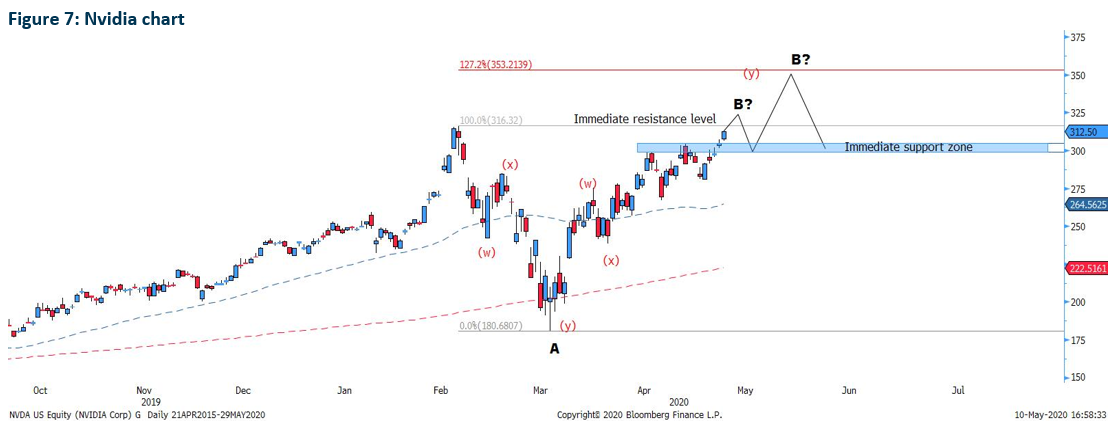
Nvidia initial sell down was performing according to our expectation based on our report on 29th April 2020. However, the unexpected bullish engulfing candle near the support level of 277 took us by surprise. Since then, the wedge formation has been invalidated and the strong bullish closure on Friday increased the probability of Nvidia taking out the top resistance at 316.32. However, we believe strongly that after breaking the resistance level, the stock will retrace and test the immediate support zone at the 300 – 302 region before edging higher to 353.21 to form an expanded flat formation.
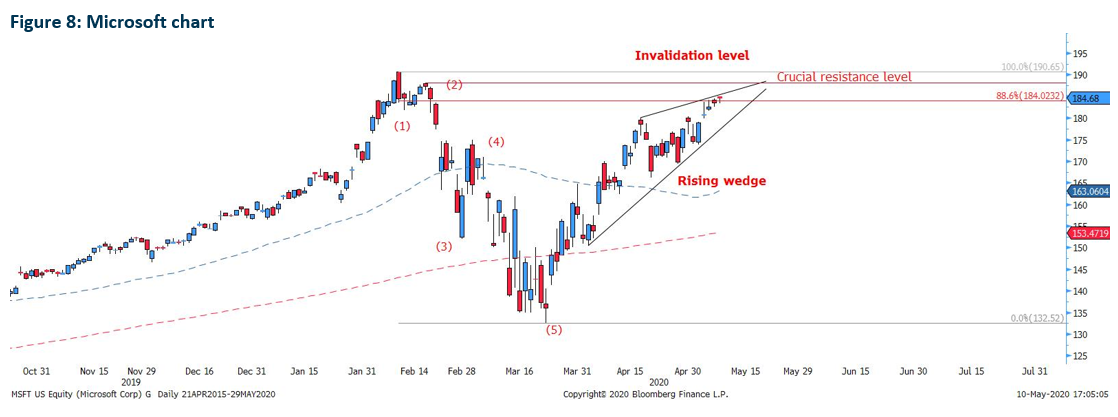
Although Microsoft has been edging higher after invalidated a double top on 30th April. The rising wedge formation remains intact with the remaining candles forming a small doji-like pattern near the resistance level of 188.00 psychological resistance level. As such, we believe that 188.00 psychological resistance will be rejected, completing the wave B of the corrective move.
Should price falls from that level, we will see that price continue its 5 sub-wave down to form wave C.
Important Information
This report is prepared and/or distributed by Phillip Securities Research Pte Ltd ("Phillip Securities Research"), which is a holder of a financial adviser’s licence under the Financial Advisers Act, Chapter 110 in Singapore.
By receiving or reading this report, you agree to be bound by the terms and limitations set out below. Any failure to comply with these terms and limitations may constitute a violation of law. This report has been provided to you for personal use only and shall not be reproduced, distributed or published by you in whole or in part, for any purpose. If you have received this report by mistake, please delete or destroy it, and notify the sender immediately.
The information and any analysis, forecasts, projections, expectations and opinions (collectively, the “Research”) contained in this report has been obtained from public sources which Phillip Securities Research believes to be reliable. However, Phillip Securities Research does not make any representation or warranty, express or implied that such information or Research is accurate, complete or appropriate or should be relied upon as such. Any such information or Research contained in this report is subject to change, and Phillip Securities Research shall not have any responsibility to maintain or update the information or Research made available or to supply any corrections, updates or releases in connection therewith.
Any opinions, forecasts, assumptions, estimates, valuations and prices contained in this report are as of the date indicated and are subject to change at any time without prior notice. Past performance of any product referred to in this report is not indicative of future results.
This report does not constitute, and should not be used as a substitute for, tax, legal or investment advice. This report should not be relied upon exclusively or as authoritative, without further being subject to the recipient’s own independent verification and exercise of judgment. The fact that this report has been made available constitutes neither a recommendation to enter into a particular transaction, nor a representation that any product described in this report is suitable or appropriate for the recipient. Recipients should be aware that many of the products, which may be described in this report involve significant risks and may not be suitable for all investors, and that any decision to enter into transactions involving such products should not be made, unless all such risks are understood and an independent determination has been made that such transactions would be appropriate. Any discussion of the risks contained herein with respect to any product should not be considered to be a disclosure of all risks or a complete discussion of such risks.
Nothing in this report shall be construed to be an offer or solicitation for the purchase or sale of any product. Any decision to purchase any product mentioned in this report should take into account existing public information, including any registered prospectus in respect of such product.
Phillip Securities Research, or persons associated with or connected to Phillip Securities Research, including but not limited to its officers, directors, employees or persons involved in the issuance of this report, may provide an array of financial services to a large number of corporations in Singapore and worldwide, including but not limited to commercial / investment banking activities (including sponsorship, financial advisory or underwriting activities), brokerage or securities trading activities. Phillip Securities Research, or persons associated with or connected to Phillip Securities Research, including but not limited to its officers, directors, employees or persons involved in the issuance of this report, may have participated in or invested in transactions with the issuer(s) of the securities mentioned in this report, and may have performed services for or solicited business from such issuers. Additionally, Phillip Securities Research, or persons associated with or connected to Phillip Securities Research, including but not limited to its officers, directors, employees or persons involved in the issuance of this report, may have provided advice or investment services to such companies and investments or related investments, as may be mentioned in this report.
Phillip Securities Research or persons associated with or connected to Phillip Securities Research, including but not limited to its officers, directors, employees or persons involved in the issuance of this report may, from time to time maintain a long or short position in securities referred to herein, or in related futures or options, purchase or sell, make a market in, or engage in any other transaction involving such securities, and earn brokerage or other compensation in respect of the foregoing. Investments will be denominated in various currencies including US dollars and Euro and thus will be subject to any fluctuation in exchange rates between US dollars and Euro or foreign currencies and the currency of your own jurisdiction. Such fluctuations may have an adverse effect on the value, price or income return of the investment.
To the extent permitted by law, Phillip Securities Research, or persons associated with or connected to Phillip Securities Research, including but not limited to its officers, directors, employees or persons involved in the issuance of this report, may at any time engage in any of the above activities as set out above or otherwise hold an interest, whether material or not, in respect of companies and investments or related investments, which may be mentioned in this report. Accordingly, information may be available to Phillip Securities Research, or persons associated with or connected to Phillip Securities Research, including but not limited to its officers, directors, employees or persons involved in the issuance of this report, which is not reflected in this report, and Phillip Securities Research, or persons associated with or connected to Phillip Securities Research, including but not limited to its officers, directors, employees or persons involved in the issuance of this report, may, to the extent permitted by law, have acted upon or used the information prior to or immediately following its publication. Phillip Securities Research, or persons associated with or connected to Phillip Securities Research, including but not limited its officers, directors, employees or persons involved in the issuance of this report, may have issued other material that is inconsistent with, or reach different conclusions from, the contents of this report.
The information, tools and material presented herein are not directed, intended for distribution to or use by, any person or entity in any jurisdiction or country where such distribution, publication, availability or use would be contrary to the applicable law or regulation or which would subject Phillip Securities Research to any registration or licensing or other requirement, or penalty for contravention of such requirements within such jurisdiction.
This report is intended for general circulation only and does not take into account the specific investment objectives, financial situation or particular needs of any particular person. The products mentioned in this report may not be suitable for all investors and a person receiving or reading this report should seek advice from a professional and financial adviser regarding the legal, business, financial, tax and other aspects including the suitability of such products, taking into account the specific investment objectives, financial situation or particular needs of that person, before making a commitment to invest in any of such products.
This report is not intended for distribution, publication to or use by any person in any jurisdiction outside of Singapore or any other jurisdiction as Phillip Securities Research may determine in its absolute discretion.
IMPORTANT DISCLOSURES FOR INCLUDED RESEARCH ANALYSES OR REPORTS OF FOREIGN RESEARCH HOUSE
Where the report contains research analyses or reports from a foreign research house, please note:
