Trade of the Day
NIO Inc. (NYSE: NIO)
(Current Price: US$8.79) – TECHNICAL BUY
Buy price: US$8.79 Stop loss: US$7.70 Take profit: US$10.70
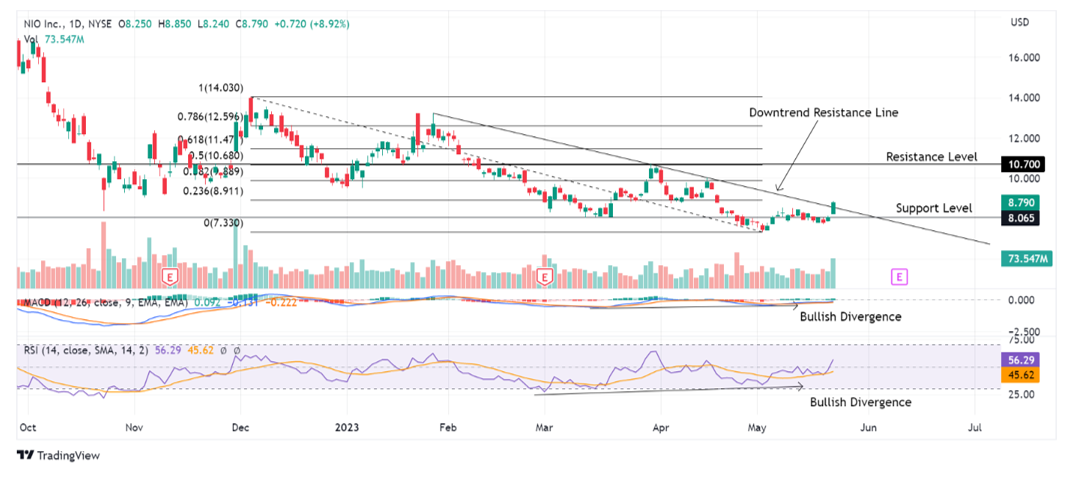
The price broke out of a downtrend resistance line on 22nd May following bullish divergence signals on both the Moving Average Convergence Divergence (MACD) and Relative Strength Index (RSI) technical indicators where higher lows were made when price made a lower low from March to May.
The price could head to test the resistance level at US$10.70, a previous swing high in end March this year, which is also confluent with a 50% Fibonacci retracement level using the swing high of US$14.03 and swing low of US$7.33.
Expected timeline of the trade is 4-8 weeks from the date of report issuance.

I analyze the stock market and conduct technical analysis to provide investment recommendations. I look forward to having a conversation with you in our in-house seminars and presentations to identify good risk-reward trading strategies together. I graduated from Nanyang Technological University with a Bachelor of Accountancy (Honours).
