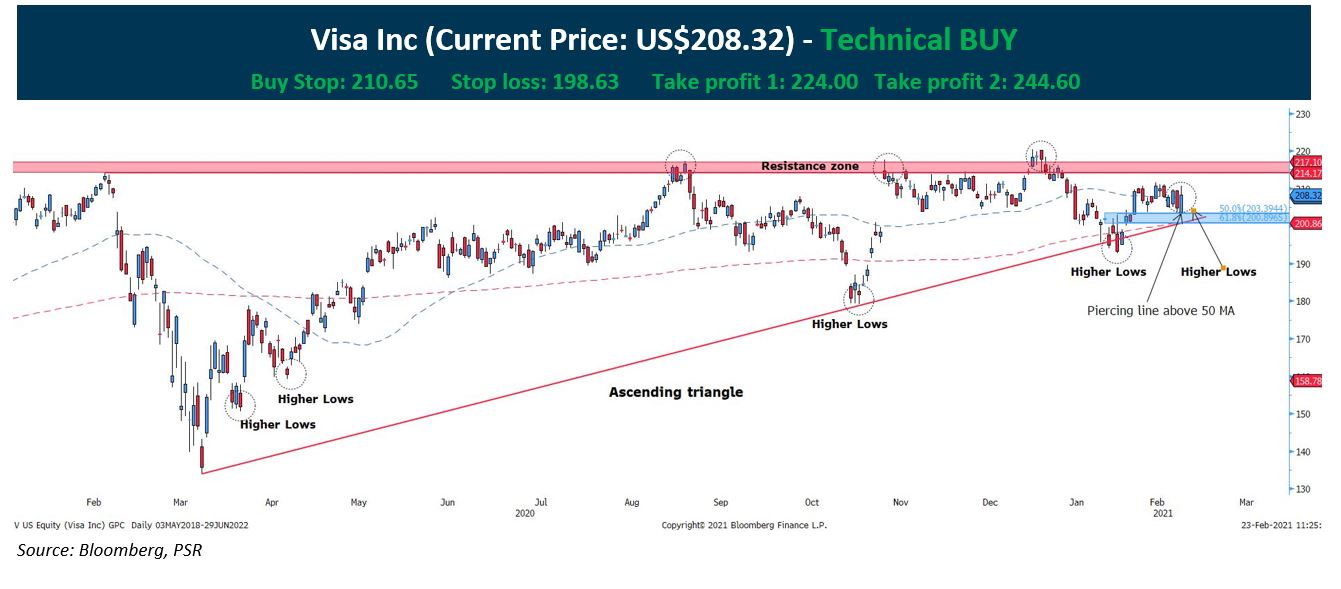
Visa (US: V) has been ranging steadily after recovering from the dip in March 2020. Recent technicals indicate that the stock is poised for a break-out from the corrective range periods:
- Despite trending in a corrective range, Visa has formed a large ascending triangle, which itself is a continuation of the bullish trend from the longer-term perspective.
- Besides that, the resistance zone has been tested thrice, weakening the resistance. Also, as the stock is pulling back from higher resistance lows.
- The bullish piercing line has successfully closed above the 50-day moving average and rebounded from the support zone at 61.8% and 50.0% Fibonacci retracement of US$192.72-US$211.83.
*Timeline of the trade is 3 weeks from the date issued.
CHART LEGENDS
Moving average
Red dotted line = 200 Periods Moving average
Blue dotted line = 50 periods Moving average
