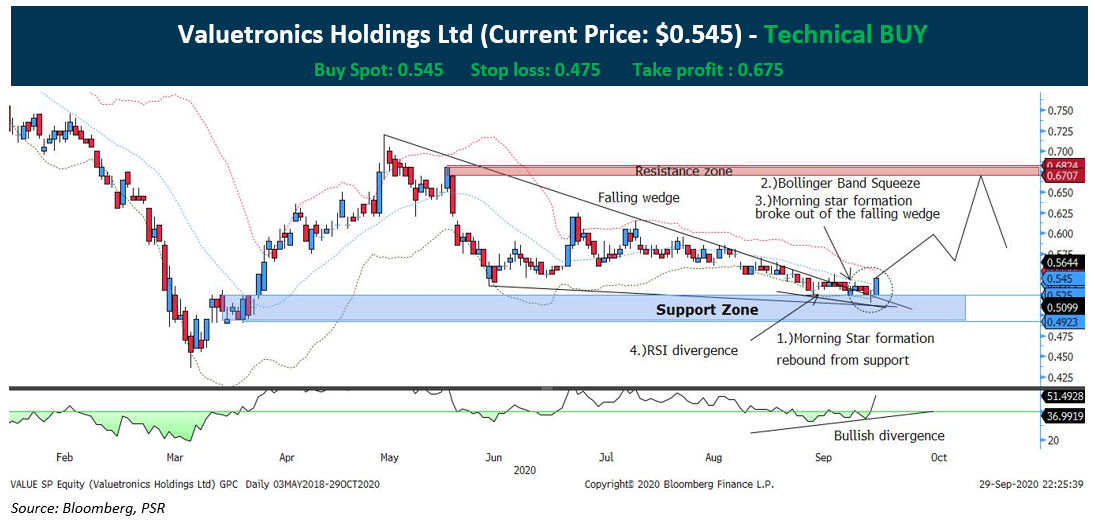
Valuetronics Holdings (SGX: BN2) corrective downside has come to an end after the stock has shown strong technical indications:
- The morning star formation has rebounded from the support zone, which is the key buying zone highlighted.
- The Bollinger band has consolidated and squeeze, which is a sign of an impending breakout to the upside. To add on, the bullish candle on Tuesday has cross above the middle band, indicating a cross to the upside.
- The morning star formation has finally broken out of the falling wedge, a key indication of a new bullish trend forming.
- Relative Strength Index (RSI) has shown a bullish divergence, thus confirming the bullish upside.
*Timeline of the trade is 3 weeks from the date issued.
CHART LEGENDS
Bollinger Bands
Red dotted line = Upper Bollinger band
Blue dotted line = Middle Bollinger band
Green dotted line = Lower Bollinger band
