Technical Pulse: Tesla, Inc November 8, 2022 651


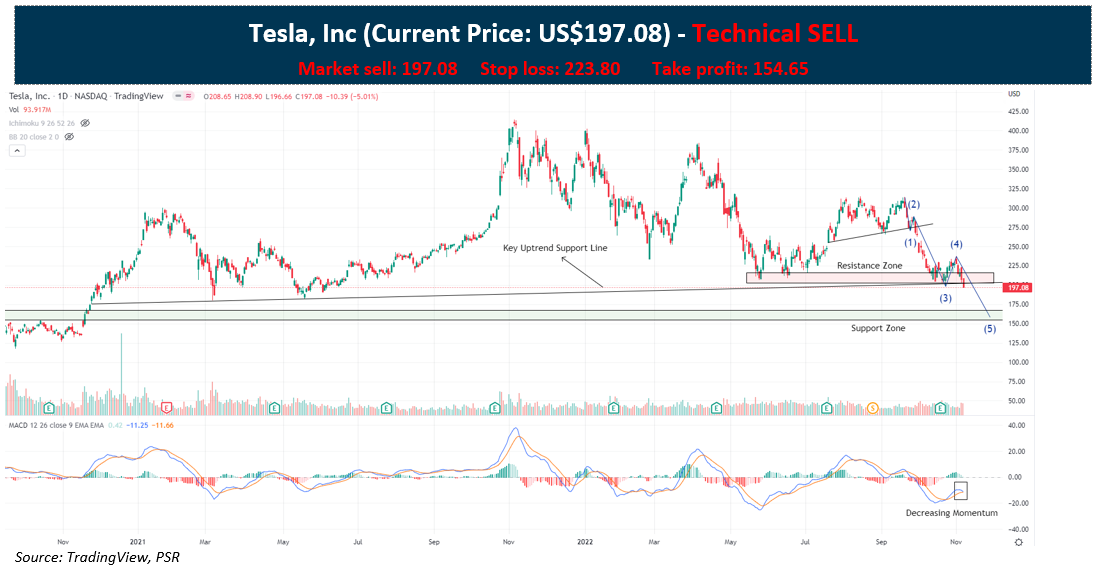
Tesla, Inc (NASDAQ: TSLA) A potential breakdown of a key uptrend support line to retest the previous resistance zone now turned support at US$154-168 as:   


  1. The price broke down the recent consolidation zone at 202-216 and key uptrend support line, which has supported the price since November 2020 on 7 November, which gives us a bearish signal.
  2. The Moving Average Convergence Divergence (MACD) technical indicator continues to display decreasing momentum and is close to a bearish crossover. The Bollinger bands are also expanding after a period of low volatility contraction, signalling possible downside momentum to follow through.
  3. From an Elliot wave perspective, the stock is currently on a 5 wave downtrend formation and could be on the 5th wave down. The projected wave 5 target would be at US$154.65, which is a 61.8% extension of the wave 1 from US$313.80 to US$270.31 and wave 3 from US$289.00 to US$198.59 combined. This downside target is also confluent with a previous horizontal resistance level now turned support that acted as resistance from September-November 2020.


*Expected timeline of the trade is 13 weeks from the date of report issuance.


CHART LEGEND

Red box = Resistance zone

Green box = Support zone

Subscribe
Notify of
guest
0 Comments
Inline Feedbacks
View all comments

About the author

Profile photo of Zane Aw

Zane Aw
Technical Analyst
PSR

I analyze the stock market and conduct technical analysis to provide investment recommendations. I look forward to having a conversation with you in our in-house seminars and presentations to identify good risk-reward trading strategies together. I graduated from Nanyang Technological University with a Bachelor of Accountancy (Honours).

Get access to all the latest market news, reports, technical analysis
by signing up for a free account today!