Technical Pulse: Singapore Exchange Ltd March 3, 2020 460


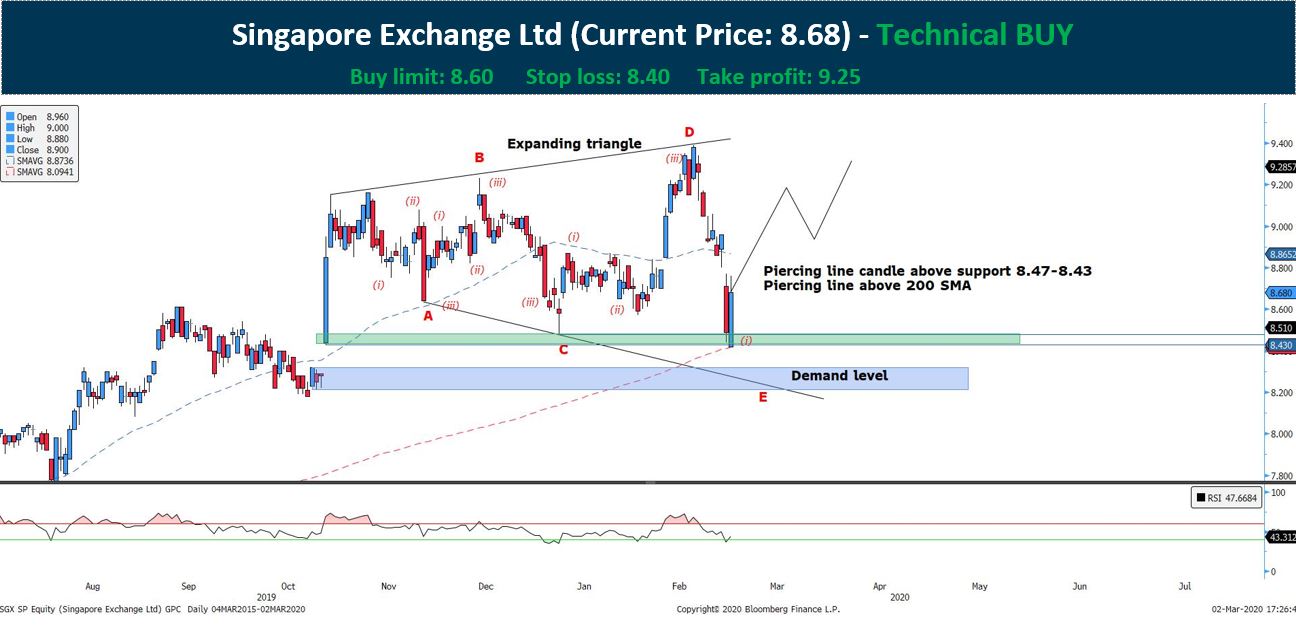
SGX (SGX: S68) bullish momentum will continue based on the technical indicated:

  1. The stock has evolved into a bullish expanding triangle and the D leg has been completed. The strong downside wave of (i) is met with a strong bullish upside on Monday open.
  2. Piercing line formation above the support level of 8.47-8.43.
  3. Piercing line above the 200 SMA.
  4. RSI oversold below the 40 line.


*Timeline of the trade should be between 1-3 weeks from the date issued.

*There is a possibility of another downside move to the demand level to formed the (iii) leg of the E wave. Should that happen, the bullish rebound will be exponential.


CHART LEGENDS

Simple Moving Average

Red dotted line = 200 SMA

Blue dotted line = 50 SMA


Subscribe
Notify of
guest
0 Comments
Inline Feedbacks
View all comments

Get access to all the latest market news, reports, technical analysis
by signing up for a free account today!