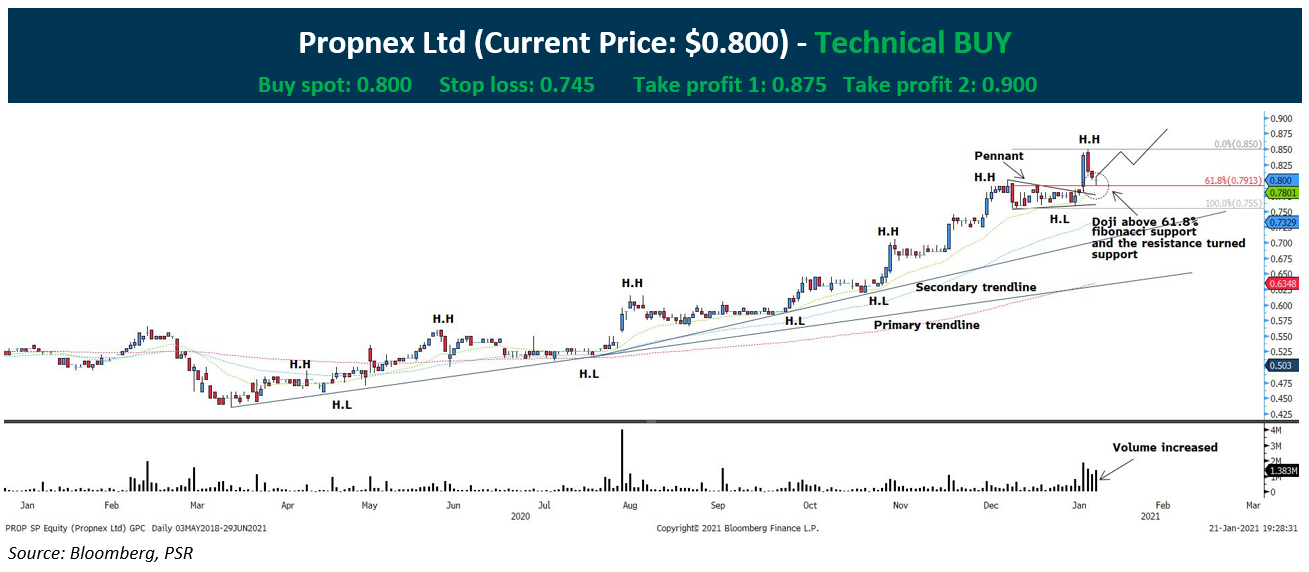
Propnex Ltd (SGX: OYY) upside remain strong and the technical indicate further upside:
- Since the strong breakout of the pennant on 18th Jan, the stock has reverted back to the resistance turned support level.
- Doji formation above the 61.8% Fibonacci retracement level, indicating the bullish buying is laying around the resistance turned support level of the pennant.
- Prices has been making a series of higher highs and higher low since last year’s March to June period. Beside that, the stock has not break nor invalidate both the primary and secondary trend line.
- Volume is seen increase on the day of the rebound.
*Timeline of the trade is 4 weeks from the date issued.
CHART LEGENDS
Moving average
Red dotted Line = 200 periods moving average
Blue dotted line = 60 Periods moving average
Green dotted line = 22 Periods moving average
