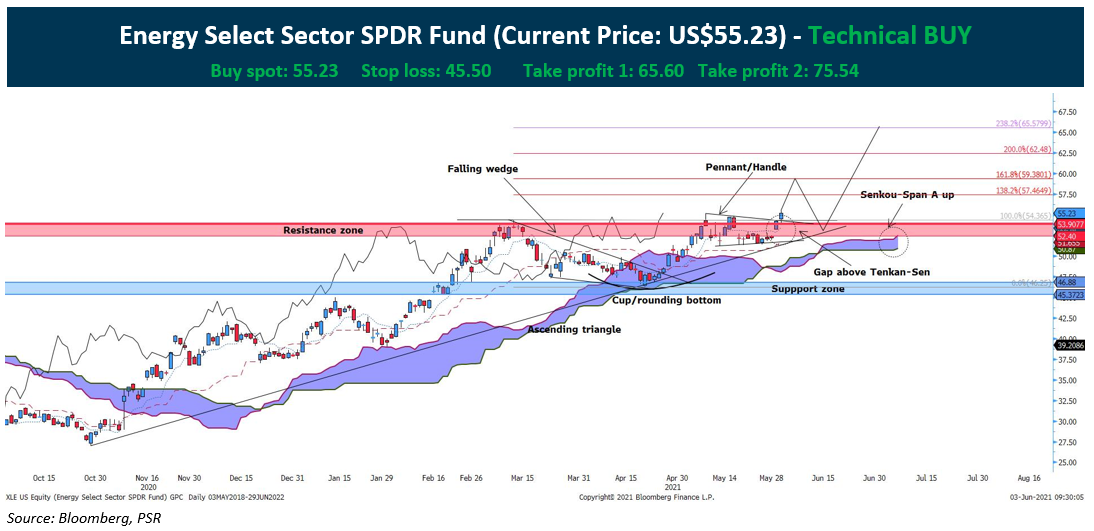
Energy Select Sector SPDR Fund (US: XLE) upside rebound since Q420 has been riding on the increased oil prices. Furthermore, multiple technical indicate that the stock can rally further:
- The ETF has not only breakout of the resistance zone at US$52.40-US$53.90, it also has broken out of the ascending triangle briefly and on Tuesday, the stock has broken out of the handle of the cup and handle formation.
- From another angle, the breaking out of the falling wedge in April 2021 confirms the bullish upside and despite facing pressure at the resistance zone, the correction was formed into a consolidative pennant, which indicate 1st a shortfall retracement and a bullish continuation pattern.
- From the Ichimoku indicator, the bullish candle on Tuesday 1st of June gap up above the Tenkan-Sen, which indicates a strong bullish signal. Furthermore, Senkou-Span A and B has is beginning to slope up and may move in parallel. All signals of the Ichimoku are pointing towards a bullish upside.
*Expected timeline of the trade is 10 weeks from the date of report issuance.
*Expect some minor pull back after prices reach between US$57.46-US$59.38.
CHART LEGEND
Ichimoku Kinko Hyo
Red dotted line = 9 Periods Tenkan-Sen
Blue dotted line = 26 periods Kijun-Sen
Green Line B= 52 periods Senkou Span B
Pink Line A = 26 periods Senkou Span A
Black line = 26 periods Chikou Span. Lagging line
