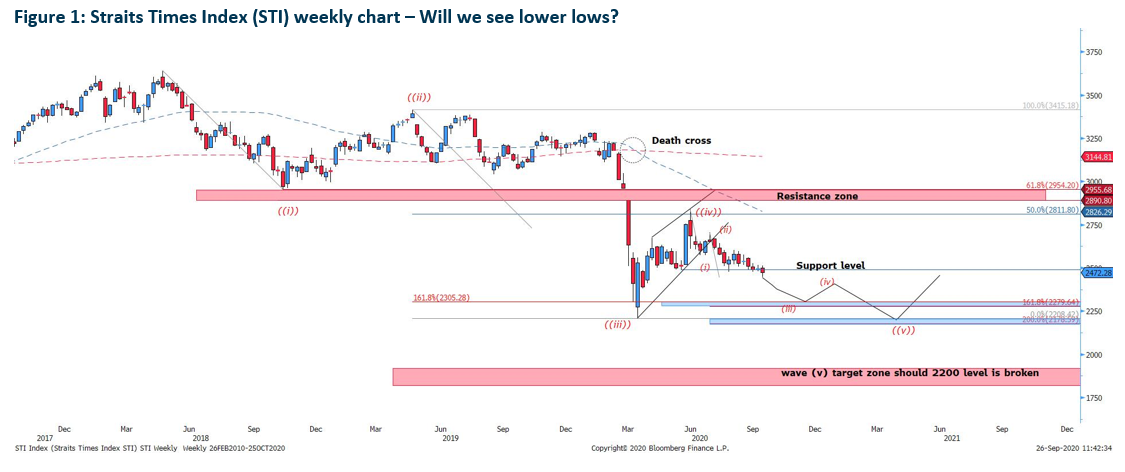
Prices has officially make a new low after breaking below 2,500 after 2 months of consolidation around 2,500.
Based on the wave theory, wave ((v)) is in the making with sub-wave (i)-(ii) completed after prices broke out of the corrective channel and wave (iii) is likely to head lower in the mid-term.
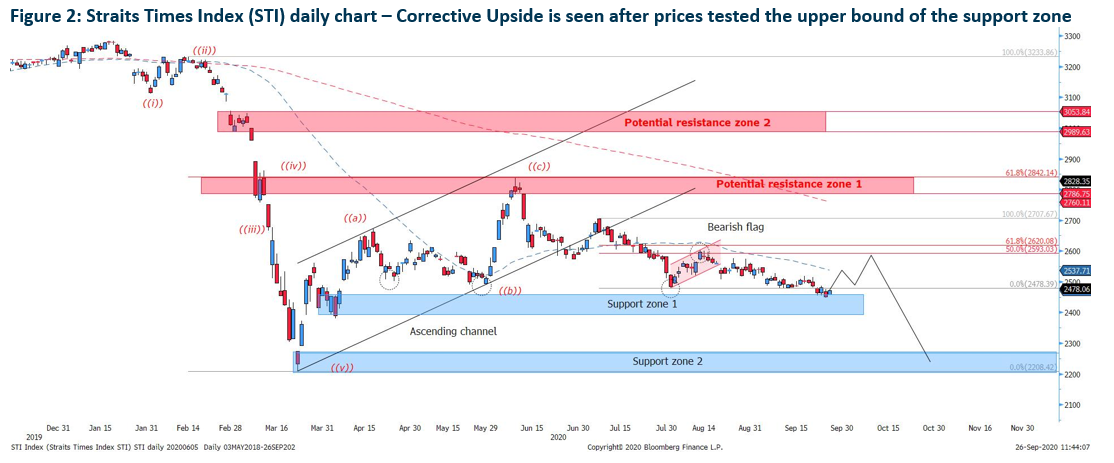
Price is seen rebounding slightly last Friday and we believe that STI will make inroad back above 2,500. However, there is a strong case that STI will reverse at 2,498.18. Should that happen, we will see STI resuming its selling and targeting support zone 2 in the mid-term.
Breaking 2498.18 will see the index reaching the upper bound of 2,591-2,601 selling zone. Should this happen, we will see an extended wave (iv) ongoing as it will be consolidating into a corrective flat pattern.
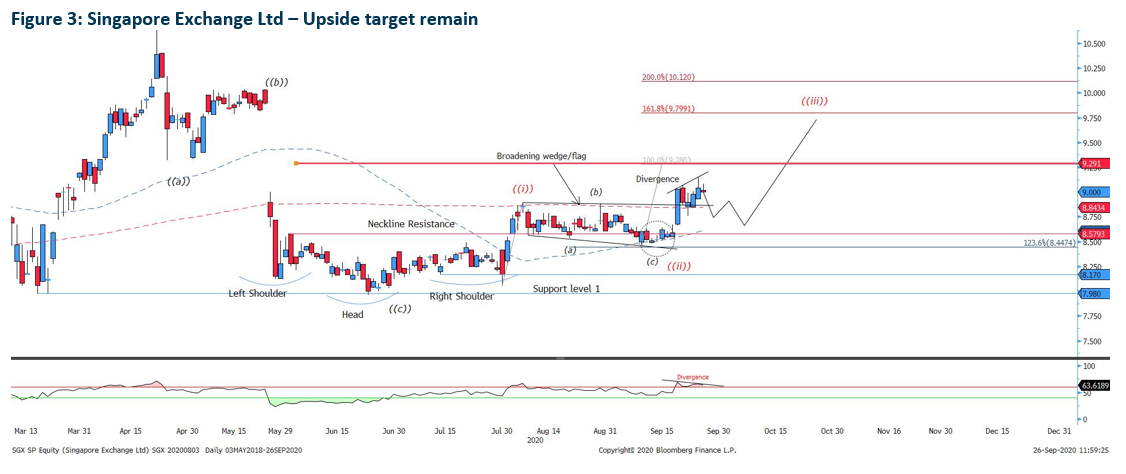
Singapore Exchange has broken out of the corrective flag/broadening wedge formation as per our analysis on 16th September. With the stock prices clearing above 200-day moving average, the upside is confirmed.
Moving forward, despite the strong upside 2 Fridays ago, the following week saw SGX consolidating at $9.00 region and not closing above the high of the bullish Marobozu at $9.02, it send off a message that further correction is expected. Furthermore, the bearish divergence formed over last week is indicative of a correction coming.
As such, we are expecting a rebound near $8.67-$8.62. However, there is a possibility that the resistance turned support at $8.87 will be the main rebound level.
*Singapore Exchange has officially incorporated into our Phillip Absolute 10 portfolio
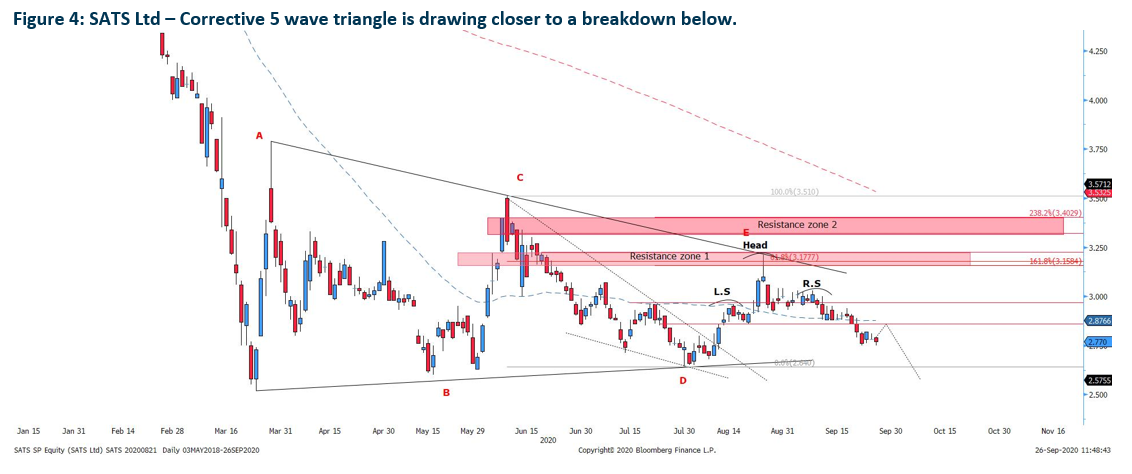
SATS Ltd has 2 bearish sell call on two occasion, one on 26th August and subsequent report on 21st September. With wave E completed and the confirmation of the head and shoulder pattern within the triangle, we are sure looking at a further sell-down towards $2.45. Which is below the 5-wave triangle.
Expect a short term rebound back to the neckline support at $2.87 before carrying on the selling.
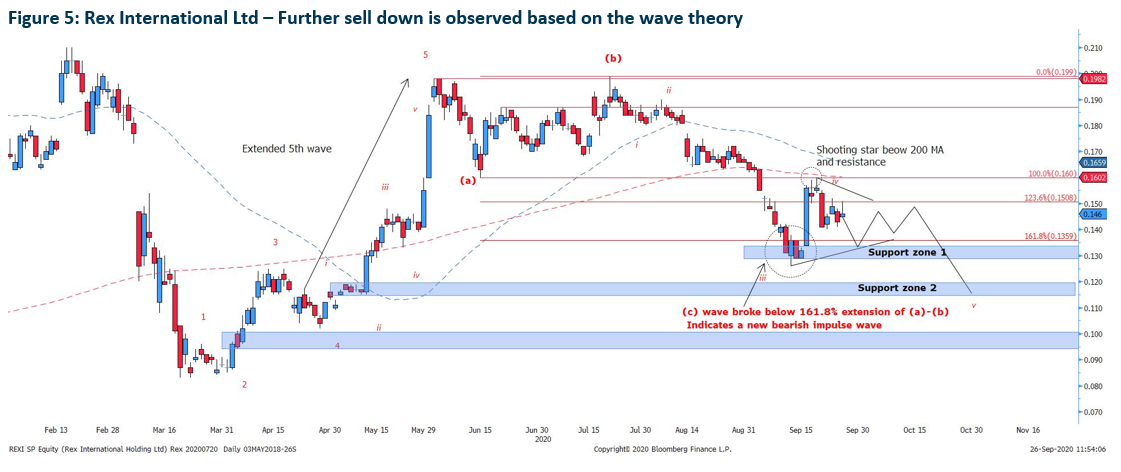
Since Rex International breaks below 123.6% and subsequent 161.8% of wave (a)(b) of the regular flat, the stock has confirmed its impulse bearish wave instead of a corrective action.
Despite the stock making huge upside on 16th September, the failure to clear above the immediate support turned resistance at $0.158-$0.160 tell us how the bull rally is an one time event. Hence, we expect further consolidation near support zone 1 to $0.146 region before resuming downside selling towards support zone 2 at $0.190-$0.130.
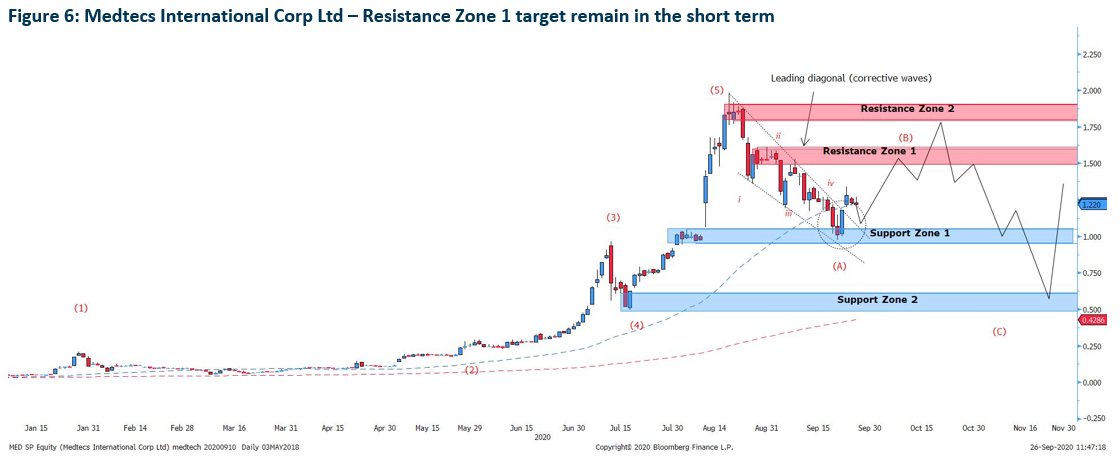
Medtecs International has a strong bullish break out of the wedge as expected based on our report on 23rd September. Despite a strong break out of the falling wedge/leading diagonal, prices will retrace to $1.16 before a rebound to the target resistance zone 1.
Long term wave analysis of a potential rebound at support zone 2 remain as per our past analysis on 23rd September.
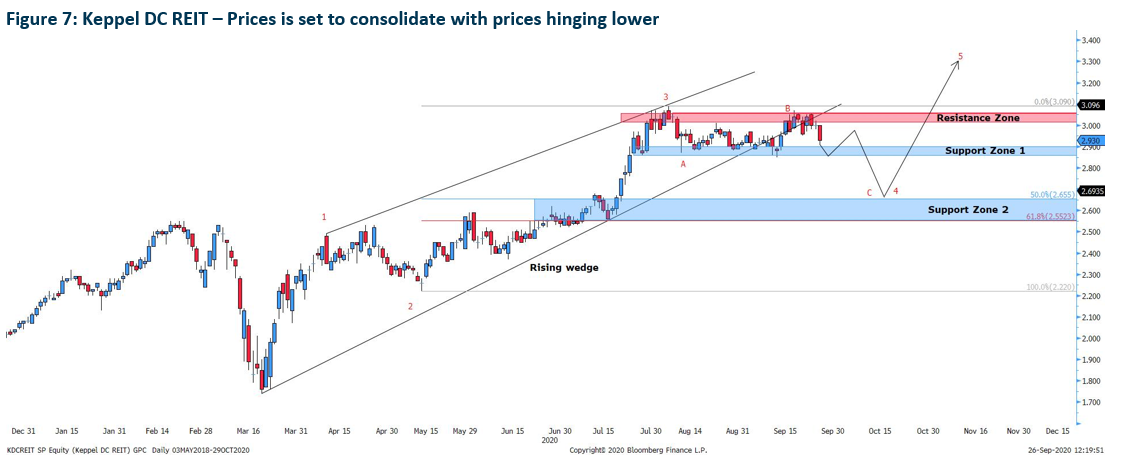
Keppel DC REIT has broken out of the rising wedge and with prices struggle to break above the $3.00 resistance zone level, the REIT is set to test the support zone 2, which is 50% and 61.8% Fibonacci retracement level of wave 3.
Short-term analysis is pointing to the REIT rebounding slightly at support zone 1 and should the rebound thereafter breaks above the resistance zone, we will see a strong impulse completing wave 5 prematurely.
