
This article was published in Business Times’ column “Chart Point” on 27 November 2017.
WTI Oil Daily chart Source: Bloomberg, PSR
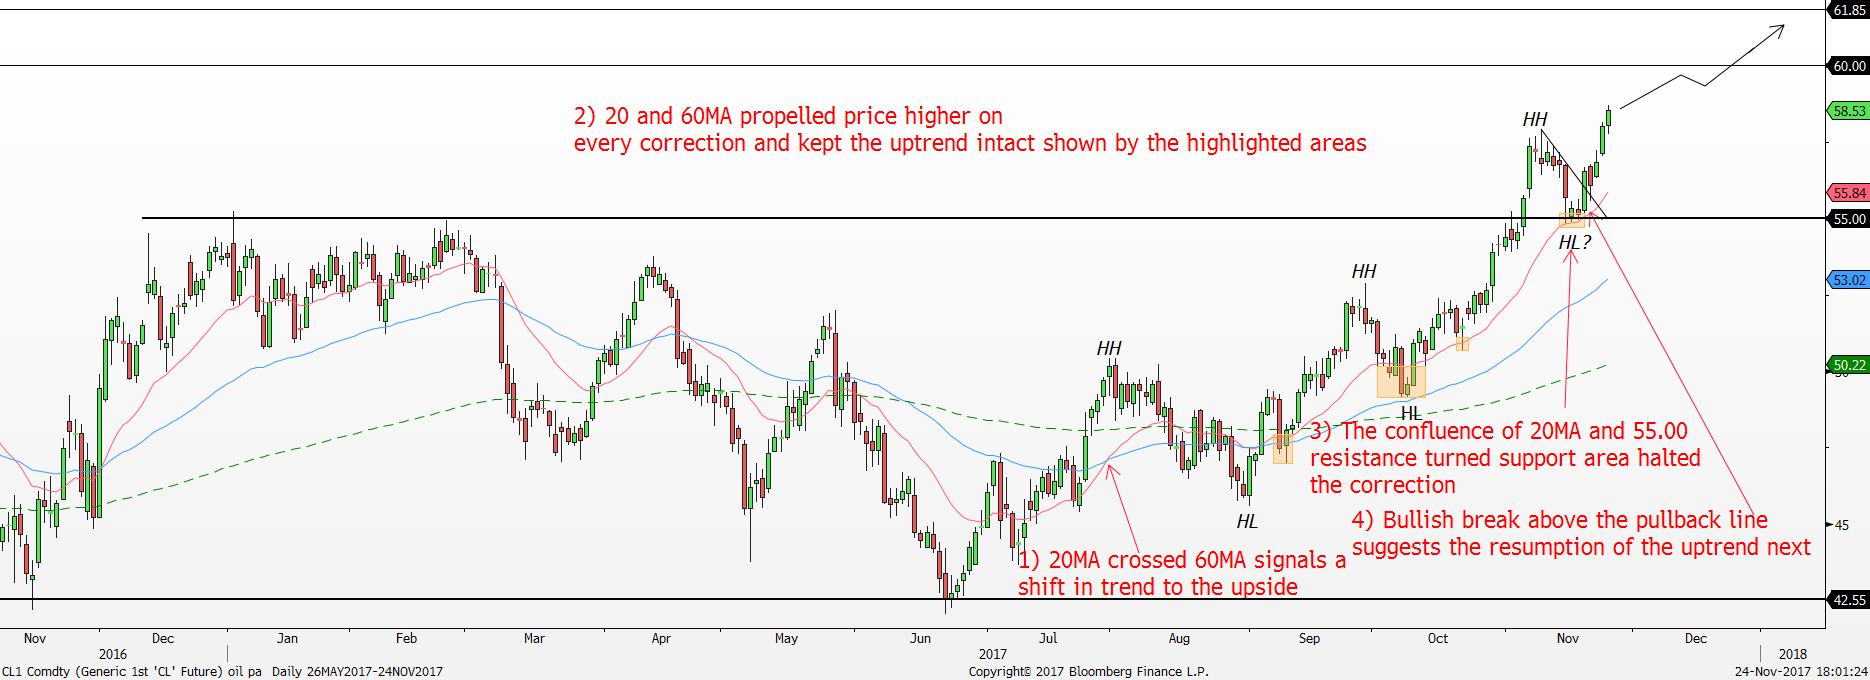
Red line = 20 day exponential moving average, Blue line = 60 ema, Green line = 200 ema
Having been stuck within $42.55 range low and $55.00 range high for the past 14 months, a breakout to the upside finally occurred for the WTI. The Saudi Arabia’s anti-corruption purge and the expectations of OPEC members still curbing oil production at the end of November OPEC meeting are the prominent catalysts for the recent breakout.
Since June 2017, the bullish rebound off the $42.55 range low has successfully moved prices into an uptrend to form a series of higher highs (HH) and higher lows (HL). The recent bullish breakout above the $55.00 range high has also validated the formation of another higher high point within this uptrend which is a bullish sign. Moreover, after the 20-day moving average crossed above the 60-day moving average on 31 July 2017, the uptrend has been firmly supported by the 20 and 60 day moving averages since then shown by the highlighted areas.
Buyers initially faced some trouble breaking above the $55.00 range high in late October to early November shown by the bearish rejections. Nonetheless, further attempts by the bulls finally broke through the $55.00 barrier on 3 November 2017, and the subsequent bullish follow-through exhibited increasing bullish momentum. Even though there was a marginal correction at the $57.92 high since 8 November 2017, the uptrend formation remains solidly intact as the previous critical psychological resistance area at $55.00 turned into the current support area. In addition, the $55.00 support area also coincided with the 20-day moving average making this a stronger support area.
Looking at the price action around the $55.00 support area provides a convincing case for a strong uptrend as buyers hurried back after price tested the $55.00 support area. As a result, a bullish break above the pullback line was formed on 17 November 2017 implying the resumption of the uptrend next. If the $55.00 support area holds, then the 14 November 2017 low of $54.81 would be the next higher low point for this uptrend.
For this current leg higher, the bulls should be targeting the $60.00 psychological area next followed by the 2015 range high of $61.85. All in all, the current bullish momentum in WTI oil since June 2017 still looks robust with further upside expected.

Jeremy specialises in Technical Analysis and has 10 years of experience in studying price action. His areas of expertise include intermarket analysis on the equities, currencies, commodities and bonds market.
He is also a regular columnist on The Business Times - every Monday ChartPoint column.
He graduated with a Bachelor of Science in Banking and Finance from University of London.
