
Tradable instruments:
ETF:
SPDR DJIA Trust – (AMEX:DIA)
SPDR S&P 500 ETF Trust – (AMEX:SPY)
Powershares QQQ Nasdaq 100 – (Nasdaq:QQQ)
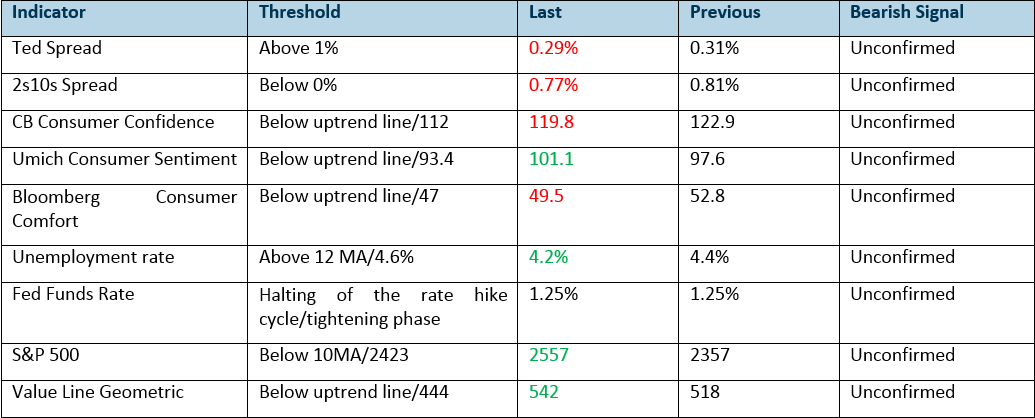
Our Phillip recession tracker is based off nine fundamental and technical indicators. The threshold represents the levels where bearish signal arises.
Red/Green represents a decline/increase from the prior month. Otherwise, it is unchanged.
One more month has passed bringing the current economic growth cycle to 99 months of expansion, third longest in history since 1933. Nonetheless, the broad-based equity market continues to march on strong with major indices such as Dow Jones Industrial Average, S&P 500 and Nasdaq 100 indexes breaking into new record high as the market continues to buy the dips on every correction even in the midst of rising geopolitical tension in North Korea. In reference to the report ”all clear for now” on the relevant indicators to watch for warning signs of a market downturn, we will be providing a monthly update on what the indicators are showing. Not much has changed since the last report except more euphoria and complacency are baked into the market.
Complacency remains the theme here as the VIX index continues to linger near the multi-decade low below 10. Additionally, shorting of volatility appears to be one of the favourite trade now with the amount of Non Commercial short contracts on the VIX Futures hovering near the record high at 346,000 contracts for the past four weeks.
In regards to consumer sentiment, the three indicators that we follow are still lingering at the euphoria point. However, the weekly Bloomberg Consumer Comfort index is taking the lead in showing some form of weakness as it has been falling for five of the last six weeks off the 53.3 high. Watch closely to see if the Conference Board Consumer Confidence and University of Michigan Consumer Sentiment index follow suit to the weakness where the simultaneous break of the multi-year uptrend line confirms the reversal in the ongoing euphoria.
The most recent labour market data showed a mixed picture as the unemployment rate stayed well below multi-year low at 4.2% while the non-farm employment change in September fell drastically to -33,000 as opposed to the +82,000 expectation. However, the sharp drop in employment was due to the impact of Hurricanes Irma and Harvey which should be transitory*. If the employment change continues to deteriorate below expectations, that might be a cause for concern.
No distress calls are being signalled yet from the interest rate complex as the interest rate related indicators remained relatively subdued and flat in September with the TED spread trading narrowly between 0.32% and 0.27%. As for the 2s10s spread, it traded in a tight range between 0.86% and 0.76%.
Even though there was no interest rate hike in September, the FED continue to present a hawkish rhetoric as it announced the balance reduction of $10 billion per month starting from October 2017. The updated view from the September FOMC meeting shows a high likelihood of a rate hike in December as suggested by the dot plot projection. Additionally, the Fed Fund Futures is also predicting a high probability of a rate hike in December with 80% as of 17 October. Hence with the ongoing hawkish tone and December rate hike, the FED still seems to be on the path of tightening which indicates all is still well. Keep in mind the moment to worry is when the FED suddenly switches to the dovish easing side.
Price action wise, the bulls have returned as the S&P 500 index marched further away from the 10-month moving average taking the monthly relative strength index further into overbought territory at 79 suggesting extreme euphoria. The equal-weighted index of Value Line Geometric also jolted back to life after testing the 509 critical level.
In conclusion, all remains well for now as none of the indicators is flashing red. We should expect to see a general move higher in the broad-based equity market as the market continues to adopt the buy the dip mentality.
Since the start of 2017, buying the dips around the 20 and 60 exponential moving average (ema) has proven to be a good strategy to time the rebound. Every retracement was firmly reversed by the 20 and 60 ema where the uptrend took back control. For example, the six weeks correction from 1 March was halted impeccably off the 60-day ema one month later in April moving the S&P 500 index back into the uptrend.
The current extremely overbought relative strength index of 80 on the daily timeframe is suggesting a near-term correction next but the 20 and 60-day moving average should continue to act as the springboard to support the uptrend.
Figure 2: S&P 500 index daily timeframe – dip buying roadmap

Source: Bloomberg, PSR
Red line = 20 period moving average, Blue line = 60 period moving average, Green line = 200 period moving average
Figure 3: Dow Jones Industrial Average index daily timeframe – dip buying roadmap
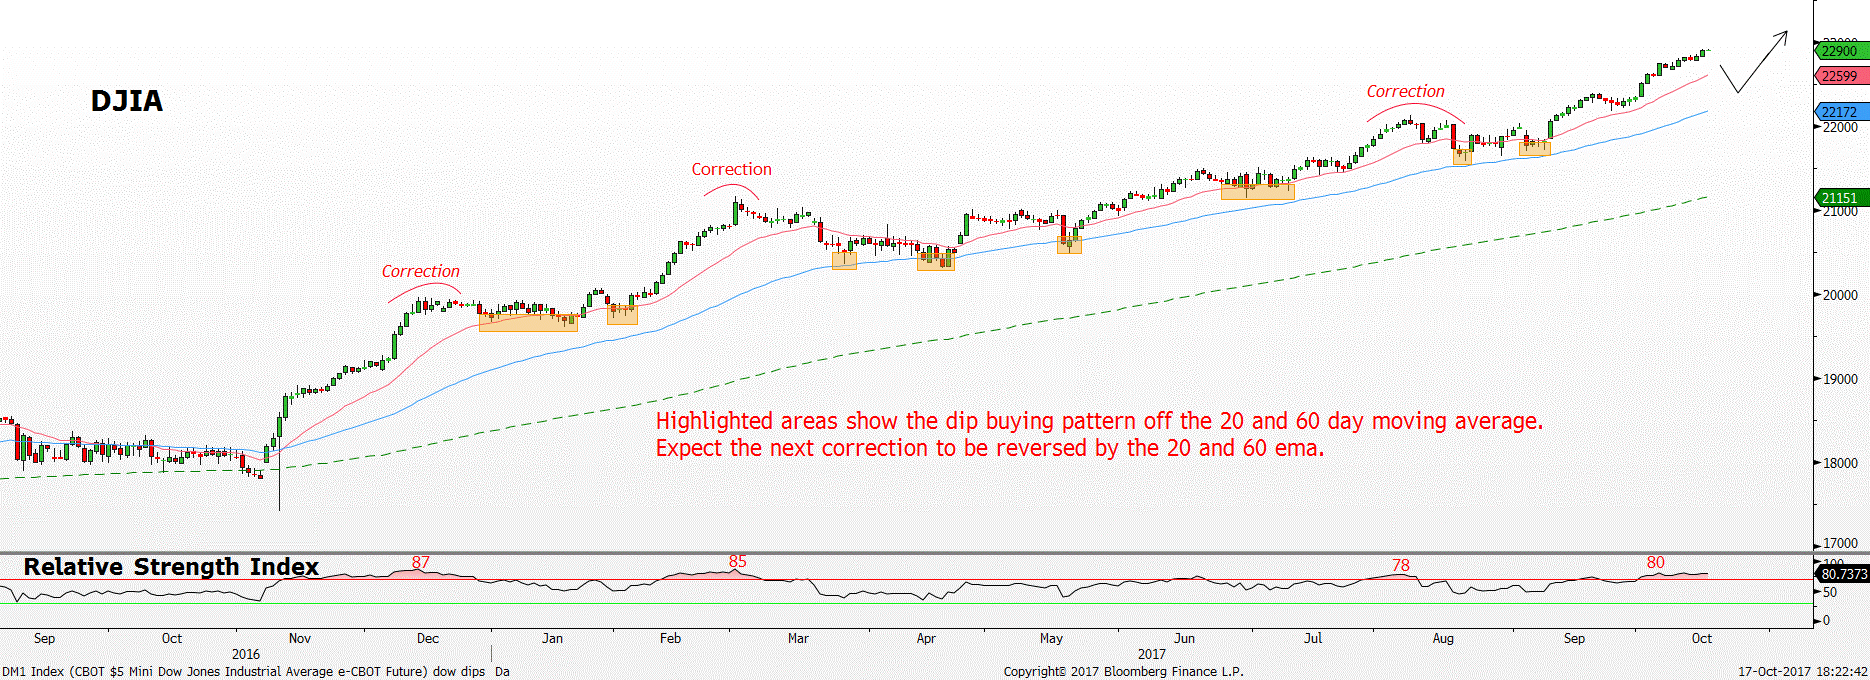
Figure 4: Nasdaq 100 index daily timeframe – dip buying roadmap

Source: Bloomberg, PSR
Red line = 20-period moving average, Blue line = 60-period moving average, Green line = 200 period moving average
On the other hand, on the bearish side, a major shift in sentiment will only occur after the S&P 500 index breaks below the 20 and 60 ema significantly. Further confirmation of a trend reversal will be flagged out once the 20 ema crosses below the 60 ema.
To sum up, watch the 20 and 60 ema closely in the near term as that will dictate if the immediate uptrend remains valid or broken.

Jeremy specialises in Technical Analysis and has 10 years of experience in studying price action. His areas of expertise include intermarket analysis on the equities, currencies, commodities and bonds market.
He is also a regular columnist on The Business Times - every Monday ChartPoint column.
He graduated with a Bachelor of Science in Banking and Finance from University of London.
