
This article was published in Business Times’ column “Chart Point” on 27 August 2018.
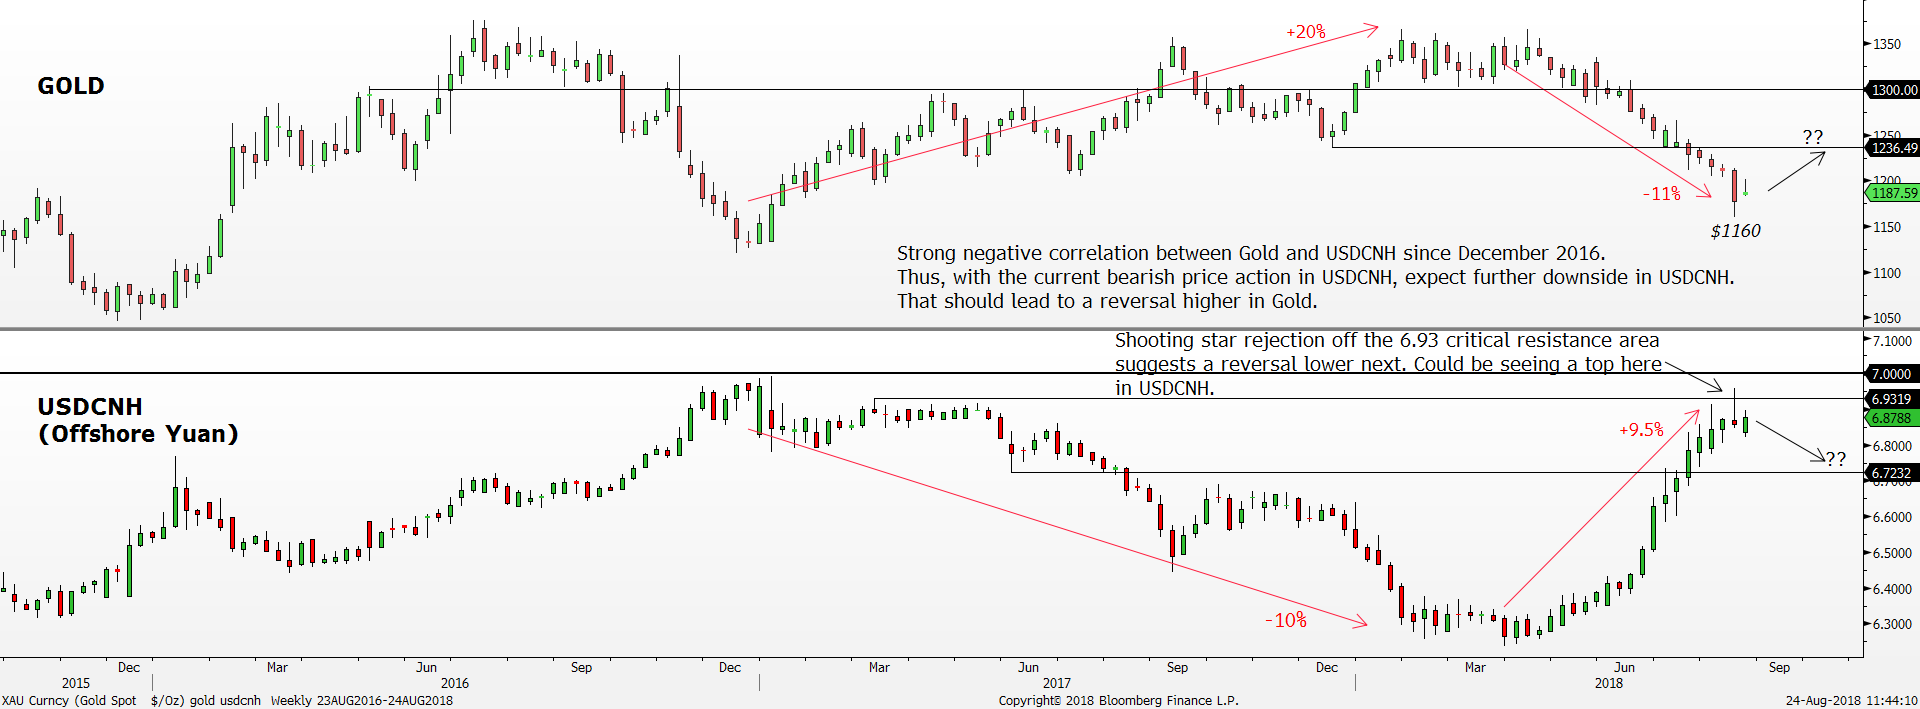
Gold vs USDCNH Weekly Timeframe
Source: Bloomberg, PSR
Gold continued to tumble to a new 52-week low lately as the $1200 key psychological round number failed to hold up. The bearish momentum accelerated right after Gold broke below the $1200 level as it hit a low at $1160, last seen in January 2017. However, this stark decline in Gold price happened in the absence of any major events.
Digging deeper, we found the real cause of the decline. It was Yuan-Gold peg that is currently driving the Gold price. Overlaying the chart of the USDCNH (Offshore Yuan) currency pair and Gold shows a very strong negative correlation. Since the USDCNH pair formed a bottom in late March, Gold also formed a similar top. Over the next three months, the USDCNH gained 9.5% while on the flipside, Gold fell a corresponding -11%. In other words, it is the strengthening dollar and weakening Chinese Yuan that is driving the past three months of Gold price movement.
Keep in mind the recent devaluation since April in the Offshore Yuan was mainly instigated to minimise the impact of the US tariffs on Chinese goods. Alternatively, one can view the continued devaluation of the Offshore Yuan as a further escalation of the trade tensions between the US and China while the strengthening of the Offshore Yuan to the dollar as a de-escalation scenario.
Recently, there was some news regarding the de-escalation of the trade tension as the USDCNH pair treads near the critical 7.0000 psychological round number. On 16 August, news of China Vice Minister of Commerce Wang Shouwen to visit the US for trade talks surfaced led to a widespread risk-on move and the Offshore Yuan appreciating 1.25% on the day. More importantly, from the price action perspective, the USDCNH pair succeeded in forming a major bearish reversal candlestick pattern, shooting star on the week ended 17 August signals a possibility of seeing a top here and the end of the deliberate Chinese Yuan devaluation. Thus, with the USDCNH acting as a leading indicator of Gold due to the strong negative correlation and the Yuan-Gold peg, expect Gold to bottom out.
Another crucial factor supporting a bullish move higher in Gold is the extreme shorts that are building up within the speculators. Our study shows a mean reversion higher in Gold tends to happen when the net speculator position is around 22,691 contracts. The last four times it happened, Gold rebounded sharply around 10% – 16% when the speculators are shunning Gold. To put things into context, the average position held by the speculators are around 128,652 contracts. The current outlook of Gold is one of the worst as the herd is net short Gold at -3,688 contracts. The last time a net short scenario played out was 16 years ago. A short squeeze happened not long after the speculators are net short in August 2002, leading to a 27% rally over the following six months. Thus, the current net short positioning from the speculator is setting up for a short squeeze soon.
Another interesting point for the near-term bullish case for Gold is the extreme bearish sentiment. With the past five months of sell-down, the weekly Relative Strength Index (RSI) has also signalled oversold condition as it fell to an extreme low of 24 in early August. The last time the RSI was in such a dire state was back in June 2013. Gold bottomed out two weeks after and rebounded around 10%. Hence, watch out for Gold to close above the $1200 psychological round number on a weekly basis to trigger the start of the mean reversion higher.
All in, we expect the negative sentiment in Gold to reverse shortly as a short squeeze higher in Gold price is inevitable. Moreover, the sharp bearish reversal in USDCNH suggests a bottom in Gold as well with the $1160 August low being the bottom. Next likely target on the way up for gold once it clears above $1200 will be $1236 resistance area followed by $1300.
However, if the Chinese Yuan were to resume the devaluation, we believe the Chinese government will defend the 7.0000 psychological round number to prevent massive capital outflow. The last time USDCNH traded near the 7.0000 psychological level in January 2017, china’s foreign reserve hit a low of 2.998 trillion, the lowest level since February 2011. Keep in mind the gradual devaluation of the Chinese Yuan from June 2014 to January 2017 led to massive capital outflow. The Chinese foreign reserve depleted from a high of 3.993 trillion to 2.998 trillion. Thus, expect the USDCNH to have limited upside moving forward with 7.0000 psychological level being the hard cap and consequently, Gold to have limited downside.

Jeremy specialises in Technical Analysis and has 10 years of experience in studying price action. His areas of expertise include intermarket analysis on the equities, currencies, commodities and bonds market.
He is also a regular columnist on The Business Times - every Monday ChartPoint column.
He graduated with a Bachelor of Science in Banking and Finance from University of London.
