Company Background
Amazon owns the leading e-commerce platform in the US, and the world’s largest cloud computing business – Amazon Web Services (AWS). Amazon’s online stores generated 51% of FY20 revenue, retail third-party seller services 21%, AWS 12%, retail subscription services 7%, advertising 6%, and physical stores 4%. The US (68% revenue) is Amazon’s biggest market, followed by Germany 8%, UK 7%, Japan 5%, and the rest of the world 12%.
Investment Merits
We initiate coverage with a BUY rating. Our target price is US$4,329 based on DCF valuation with a WACC of 6.2% and terminal growth of 5%.
REVENUE
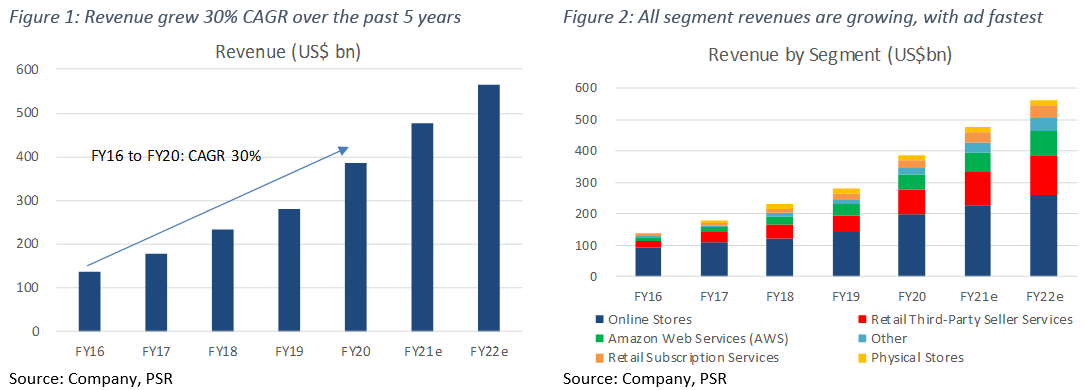
Amazon has six sources of revenue: online stores (51% of FY20 revenue), retail third-party seller services (21%), Amazon Web Services (12%), retail subscription services (7%), other – ads (6%), and physical stores (4%). The US (68% of FY20 revenue) is Amazon’s biggest market, followed by Germany (8%), the UK (7%), Japan (5%), and the rest of the world (12%). Total revenue has expanded at 30% CAGR over the past 5 years, riding on the growth of e-commerce, cloud, and digital ad markets, where Amazon holds leadership ranks.
Advertising is Amazon’s fastest growing segment, which makes up 90% of ‘other’ revenue. It grew 66% CAGR from FY15 to FY20 and is expected to grow 53% in FY21. We expect AWS to emerge as the second fastest grower at 33% in FY21 as revenue from online stores and retail third-party seller services normalise after spiking from the onset of COVID-19.
EXPENSES
Cost of sales grew at 20% CAGR in the past five years, compared to revenue growth of 30%. Operating expenses grew more in line at 28% CAGR. Operating expenses include fulfilment (15% of FY20 revenue), technology & content (11%), marketing (6%) and general & administrative (2%) costs. Technology & content, marketing, and general & administrative costs have remained in stable ranges of 11.1% to 12.8%, 5.3% to 6.7%, and 1.7% to 2.1% of revenue respectively. However, fulfilment costs have risen from 13.0% to 15.2% due to fulfilment network expansion, higher staff costs and COVID-19 productivity reduction.
MARGINS
Operating margins have gradually risen from 3% to 6% from FY16 to FY20. AWS and advertising are Amazon’s main sources of operating income and margins. AWS operating margins are at 30%, up from 25%, while advertising margins are estimated to be higher than 50%, in line with other large pure-play digital ad companies. We estimate the retail business (merchandise sales) to operate at a negative 0.4% operating margin.
BALANCE SHEET
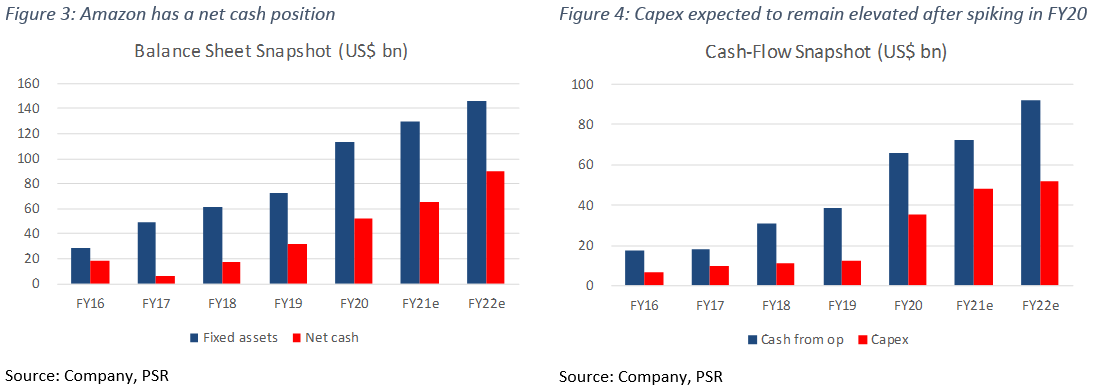
Assets: Fixed assets have grown by four times to US$113bn in the last five years as Amazon expanded its network of fulfilment warehouses and data centres. It spiked 56% in 2020 as Amazon accelerated fulfilment capacity to meet pandemic demand for online sales. Fixed assets made up 35% of total assets, and is expected to grow an additional 15% in 2021.
Liabilities: Amazon has a net cash position of US$53bn, which grew at 30% CAGR from US$18bn in the past five years (Figure 3).
CASH-FLOW
Cash-flow from operations spiked 72% YoY to US$66bn in FY20 from increased profitability during the pandemic, while capex almost tripled YoY to US$35bn from aggressive expansion (Figure 4). Capex as a % of operating cash-flow is expected to remain above 50% compared to the pre-pandemic average of 41% as Amazon continues to expand fulfilment and AWS capacity