
This article was published in Business Times’ column “Chart Point” on 14 May 2018.
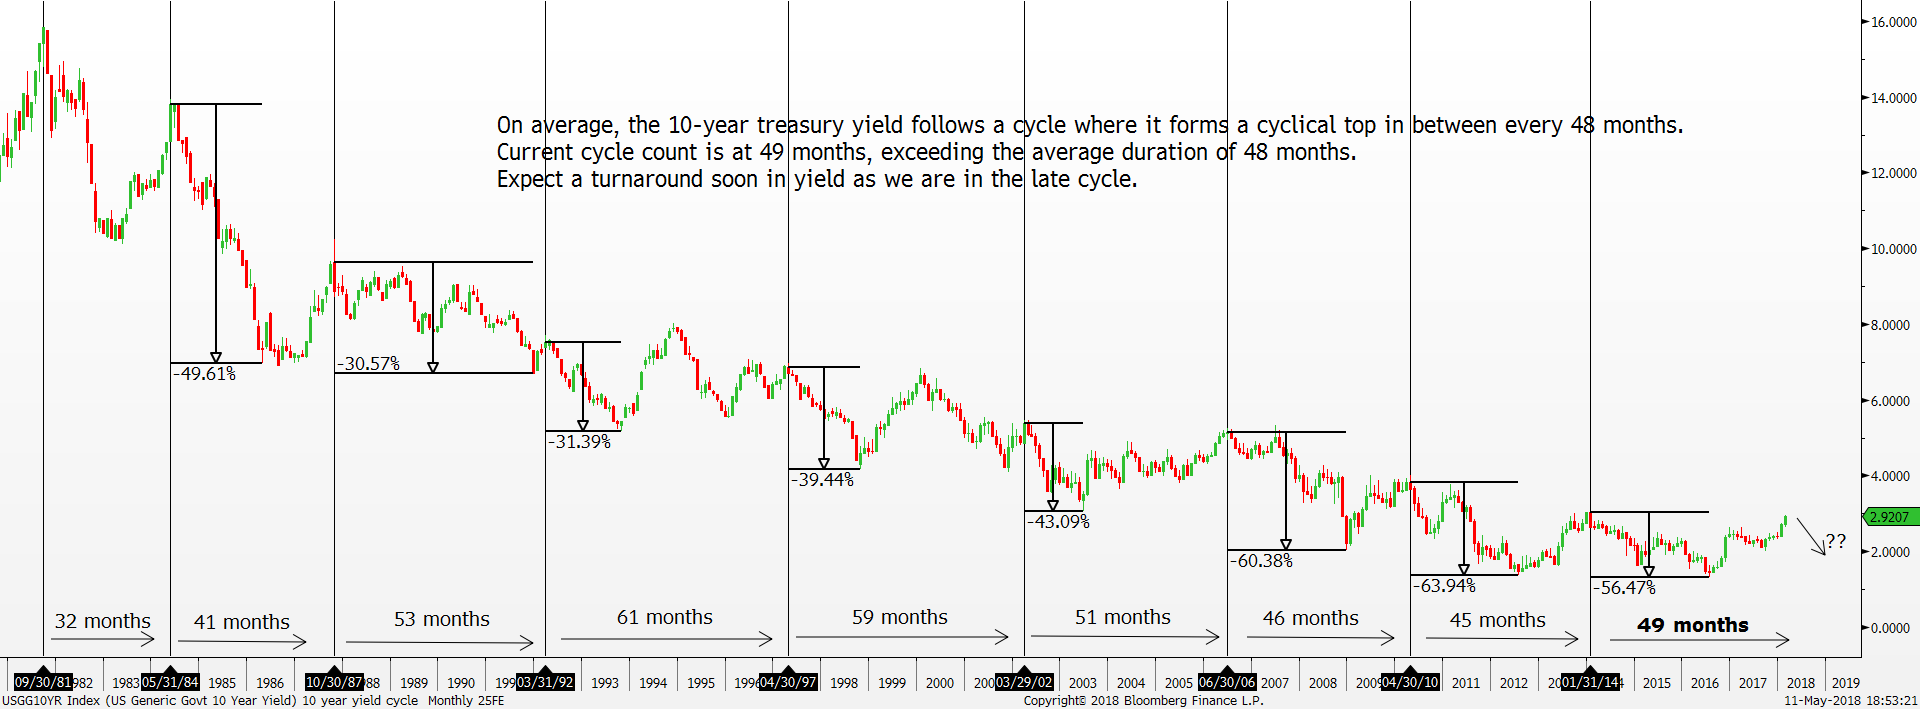
10-year treasury yield Monthly Chart Source: Bloomberg, PSR
After the 10-year treasury yield hit a record high of 15.82% in September 1981, its general trend has been in a stark decline, and it hit a low of 1.38% in 2012. In other words, the bond market has been in a surging bull run for the past 37 years as the yield moves inversely to the bond price.
Looking at the longer-term picture of the 10-year treasury yield reveals an interesting cycle, and we might be seeing the start of another major leg lower in the 10-year treasury yield. Since the bond bull market began in 1981, on average the 10-year treasury yield forms a cyclical top every 4 years or 48 months. The way we measure the cyclical top is to identify major reversal tops, and our study shows it takes the market on average 4 years to form a cyclical top to the next cyclical top shown by the vertical lines in the chart. There were a total of 8 cycles that played out with the 4 years duration. Note that the cycle does not happen exactly in between every 4 years but approximately around that range. Thus, it is better to use it as a gauge to measure where we are in the cycle. The shortest cycle was 32 months from 1981 to 1984 while the longest cycle was 61 months from 1992 to 1997. Another interesting observation about the cycle is the cyclical tops tend to be signalled by key bearish price action candlestick patterns such as Bearish Engulfing Bar and Shooting Star.
Notice how after each cyclical top is formed, the 10-year treasury yield falls into a brand new downtrend, restarting the bull market in the bond complex. On average, the 10-year treasury yield tends to fall around –46% once the cyclical top is established off its high. For instance, the most recent cyclical top took 45 months to complete in January 2014 as the previous cyclical top was found in April 2010. For that cycle, it was slightly shorter than the average 48 months duration, but it was confirmed by a Bearish Engulfing Bar in January 2014 which kick-started the secular downtrend, taking the 10-year treasury yield down -56% from 3.05% to 1.31%.
Fast forward to current time, the reference point for the previous cyclical top was the 3.05% high back in January 2014. Using that as the anchor point for calculating the current cycle leads us to 49 months of for being in this cycle. Put differently, the current cycle is overdue for a downturn as it exceeds the average cycle duration of 48 months. The cycle study suggests limited upside in the 10-year treasury yield as we approach the far end of the cycle. This is not to say the rising yield environment will reverse immediately at the 49-month mark, but other factors are pointing to seeing a reversal lower too.
There is a significant resistance overhead at the 3.05% level and 150-month moving average that should cap the ascent in the 10-year treasury yield. Moreover, the speculators are extremely short the 10-year Treasury bond suggesting an imminent short squeeze soon which would cause the yield to turn back down. As long as the critical 3.05% resistance level stays intact, expect the next cyclical top to be established soon where a new secular downtrend in the 10-year yield takes over. That scenario should bode well with the general equity market as fears of extended rising interest costs subside.

Jeremy specialises in Technical Analysis and has 10 years of experience in studying price action. His areas of expertise include intermarket analysis on the equities, currencies, commodities and bonds market.
He is also a regular columnist on The Business Times - every Monday ChartPoint column.
He graduated with a Bachelor of Science in Banking and Finance from University of London.
